MOTION

DISTANCE & DISPLACEMENT
Distance (d) - numerical measurement of the length between two objects or points
-
scalar quantity
-
SI unit is meter (m)
Displacement (s) - the shortest distance from the origin point to the final destination
-
vector quantity
-
SI unit is meter (m)
If an object moves forward from the origin point 3 centimeters, back 2 centimeters, and forward 6 centimeters, the distance travelled by the object is 11 centimeters; if an object moves forward from the origin point 3 centimeters, back 2 centimeters, and forward 6 centimeters, it has been displaced by 7 centimeters to the right.
SPEED & VELOCITY
Speed - the rate at which an object covers distance; a quantity that can be used to describe how fast or slow an object is moving
-
scalar quantity
-
SI unit is meters per second (m/s)
Velocity (v) - used to describe how fast or slow an object is moving in a given direction; the rate at which an object is moving in a given direction
- vector quantity
-
SI unit is meters per second (m/s)
If an object is moving an average of 10 kilometers every 20 minutes, the object’s speed is 30km/h; if an object is moving an average of 10 kilometers north every 20 minutes, the object’s velocity is 30km/h north-bound.
The velocity of an object is likely constantly changing. This is why we refer to velocity as either:
-
Instantaneous velocity - the velocity of an object at any given moment
-
Average velocity - the average velocity of an object over any given period of time
ACCELERATION
Acceleration (a) - the rate at which the velocity of an object changes over a period of time
-
vector quantity
-
SI unit is meters per seconds-squared (m/s^2)
When finding instantaneous acceleration, time is equal to zero; this is not the case for the process of finding average acceleration.

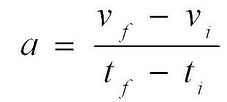

EQUATIONS OF MOTION
Conditions for using the equations of motion:
-
All quantities must be in SI units
-
motion must be linear
-
acceleration must be constant
FREEFALL MOTION
Freefall motion - any motion of a body in which gravitational force is the only force acting on it, unless stated otherwise
In freefall motion, objects accelerate towards the ground; that acceleration has varying values at different places in the universe.
On Earth, the gravitational field strength is 9.8 m/s^2 - this means that, assuming there is no effect of resistive force, the speed of the freely falling object would increase by 9.8 m/s every second.
MOTION GRAPHS
Motion graphs can be used to
-
Depict motion visually
-
Calculate kinematic variables
In most (if not all) motion graphs, time will always be shown on the x-axis. The x-axis usually represents the independent variable, whereas the y-axis shows the dependent variable.
The important features of any motion graph that you may be asked to find are the gradient and the area under the graph.
There are many types of motion graphs:
-
Position-time graph
-
Distance-time graph
-
Velocity-time graph
-
Acceleration-time graph


POSITION-TIME GRAPHS
In a position-time graph, the gradient is the velocity. In some cases, the position-time graph can be considered the same as a displacement-time graph. For the following notes, 'positive' and 'negative' refers to direction of velocity rather than magnitude - remember that velocity and acceleration are both vector quantities.
Position-time graphs with a straight line (see Fig. 1):
-
the object is moving at a constant speed
-
an upward-pointing line depicts motion being of a positive velocity - in the forwards or upwards direction
-
a downward-pointing line depicts motion being of a negative velocity - in the downwards or backwards direction
Position-time graphs with a curved line (see Fig. 2):
-
the object is either accelerating in either a positive or negative direction
-
if the gradient/velocity is decreasing, the object would be accelerating negatively
-
when the velocity is positive and decreasing, the object is slowing down in the positive direction
-
when the velocity is negative and decreasing, the object is speeding up in the negative direction
-
-
if the gradient/velocity is increasing, the object would be accelerating positively
-
when the velocity is positive and increasing, the object is speeding up in the positive direction
-
when the velocity is negative and increasing, the object is slowing down in the negative direction
-
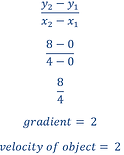

Fig. 1 - Position-time graph with a straight line.
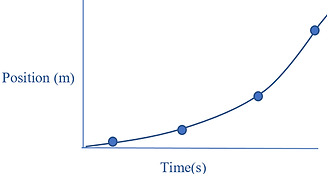
Fig. 2 - Position-time graph with a curved line; this graph depicts increasing velocity, therefore positive acceleration.
DISTANCE-TIME GRAPHS
In a distance-time graph, the gradient is the speed. A distance-time graph can never have a negative slope, because distance and speed are both scalar quantities meaning that they do not possess a directional element. The magnitude of speed or distance cannot be below zero. A downwards-sloping line would indicate a decrease in distance, which is not possible - motion in a different direction would still contribute to an increasing amount of length being covered.
Distance-time graphs with a straight line:
-
the object is moving at a constant speed
-
if the gradient is greater than zero, distance is being covered at the given speed (gradient)
-
if the gradient is zero, distance is not being covered and the object is stationary
Distance-time graphs with a curved line:
-
the object is either accelerating or decelerating
-
if the gradient is decreasing, the object would be decelerating
-
if the gradient is increasing, the object would be accelerating
VELOCITY-TIME GRAPHS
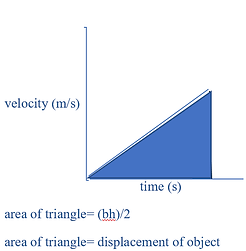
In a distance-time graph, the gradient is the acceleration; the area under the graph is displacement. The velocity is indicated by the y-axis value, whereas time lies on the x-axis as usual. For the following notes, 'positive' and 'negative' refers to direction of velocity rather than magnitude - remember that velocity and acceleration are both vector quantities.
Velocity-time graphs with a straight line:
-
the object is moving at a constant acceleration
-
if the gradient is zero, the velocity is constant and the object is not accelerating
-
if the gradient is greater than zero, the object is accelerating positively
-
if the gradient is greater than zero and the velocity is negative (y-axis value), the object is slowing down in the negative direction
-
if the gradient is greater than zero and the velocity is positive (y-axis value), the object is speeding up in the positive direction
-
-
if the gradient is less than zero, the object is accelerating negatively
-
if the gradient is less than zero and the velocity is negative, the object is speeding up in the negative direction
-
if the gradient is less than zero and the velocity is positive, the object is slowing down in the positive direction
-
Velocity-time graphs with a curved line:
-
the object is moving with a non-constant acceleration
-
the same rules as above will apply, keeping in mind that the acceleration (whether positive or negative) is not constant


ACCELERATION-TIME GRAPHS
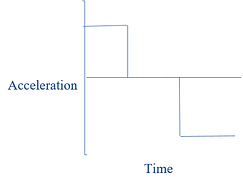
In an acceleration-time graph, the gradient is the jerk; the area under the graph represents the change in velocity. The jerk is a quantity that describes change in acceleration. The change in velocity is not the same as the initial or final velocity.
Acceleration-time graphs with a straight line:
-
if the gradient is zero, the object is moving at a constant acceleration
-
if the gradient is greater or less than zero, the object is moving at a non-constant acceleration
Acceleration-time graphs with a curved line:
-
the object is not moving at a constant acceleration
